Visualizing Environmental Damage with Vector Infographics
Environmental damage is a complex topic that affects ecosystems, communities, and economies worldwide. Communicating this effectively requires tools that simplify data without losing its impact. That’s where the Environmental Damage Vector Infographic comes in. It’s a design template that helps turn intricate environmental data into clear, engaging visuals.
This infographic uses vector graphics, which means the images can scale without losing quality. Whether you're presenting to a classroom, publishing a report, or sharing on social media, these visuals stay sharp and professional. The template includes elements like icons, charts, and timelines, making it versatile for different storytelling needs.
Why Use an Environmental Damage Infographic?
One of the biggest challenges in environmental communication is making data relatable. Numbers and scientific terms can be hard to grasp, especially for people without a technical background. The Environmental Damage Vector Infographic helps bridge that gap by turning data into visuals that are easier to understand and more memorable.
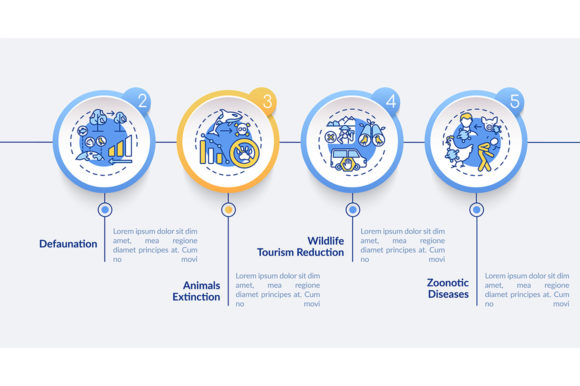
For example, a timeline chart included in the template can show how defaunation—loss of animal species—has accelerated over the decades. This visual storytelling makes it easier for audiences to see trends and grasp the urgency of environmental issues. It’s not just about showing facts—it’s about creating a connection between data and real-world impact.
Who Benefits from These Infographics?
Anyone who needs to explain environmental issues clearly can benefit from this tool. Educators can use it in lessons to help students understand ecological changes. Bloggers and marketers can create compelling content that stands out on digital platforms. Entrepreneurs and small business owners might use it to show sustainability efforts in annual reports or presentations.
Professionals in conservation, urban planning, or climate science can also use these infographics to communicate findings to stakeholders. Even hobbyists passionate about nature can create informative visuals to share with their communities. The flexibility of the template makes it suitable for a wide range of uses, both personal and professional.
How to Use the Environmental Damage Vector Infographic Template
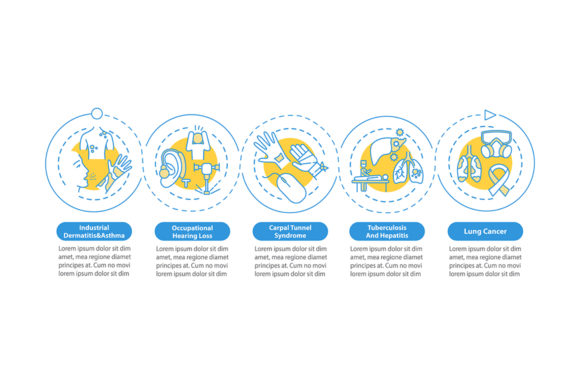
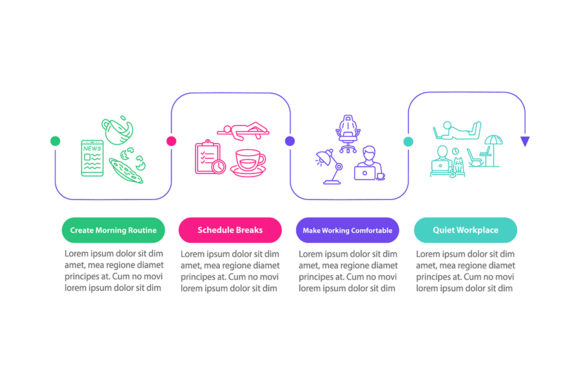
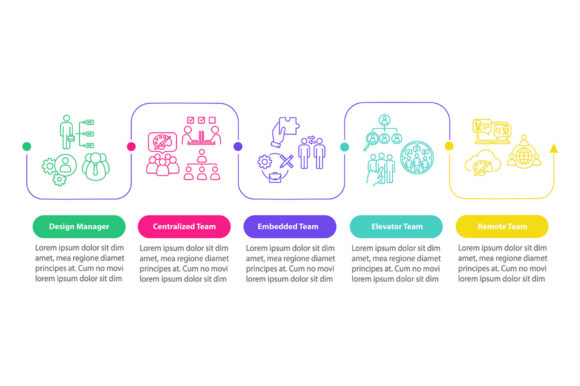
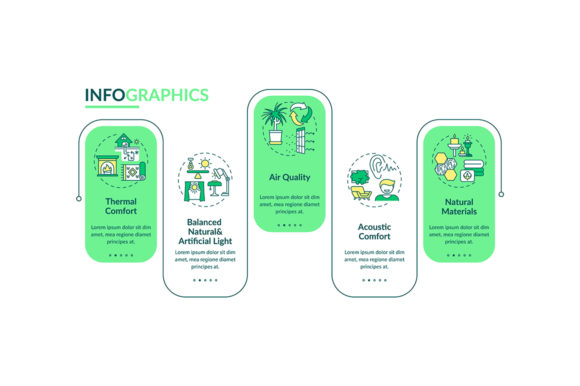
The template includes a data visualization with 4 steps, allowing you to break down complex environmental processes into digestible parts. For instance, you might use it to explain how deforestation leads to habitat loss, which then affects biodiversity, and so on. Each step can be customized with icons, text, and color schemes that match your message.
The workflow layout with linear icons is especially useful for showing cause-and-effect relationships or step-by-step processes. Whether you're illustrating the impact of pollution on marine life or the stages of reforestation, these icons help guide the viewer through the narrative smoothly.
The ZIP file includes multiple file formats—EPS, JPG, PNG, SVG, AI—so you can use the template in a variety of design software. Whether you're working in Adobe Illustrator or a simpler tool like Canva, you’ll find a format that fits your needs.
Real-World Examples and Use Cases
- Classroom Education: Teachers can use the process timeline chart to show how environmental damage has evolved over time, helping students visualize historical trends.
- Nonprofit Campaigns: Environmental organizations can create infographics to highlight the effects of climate change in fundraising materials or awareness campaigns.
- Business Sustainability Reports: Companies can visually present their environmental impact and sustainability goals in annual reports using the template’s clean layout.
- Online Articles and Blogs: Content creators can enhance their storytelling with visuals that make data more engaging and shareable on social media.
Things to Consider Before Using the Template
While the Environmental Damage Vector Infographic is a powerful tool, there are a few things to keep in mind before diving in. First, make sure your data is accurate and up to date. Visuals are only as trustworthy as the information they represent.
Also, consider your audience. Are they familiar with environmental terms, or should you explain concepts in simpler language? The template allows for customization, so you can adjust the level of detail based on who you're speaking to.
Finally, think about the overall message you want to convey. Infographics should tell a story, not just display data. Whether you're raising awareness, promoting action, or explaining a scientific process, clarity and purpose should guide your design choices.
Getting the Most from the Template
Because the template comes with a range of design elements—like defaunation presentation design elements and a process timeline chart—you have the flexibility to tailor your visuals to your specific needs. You can mix and match components to create infographics that suit different platforms and purposes.
If you're new to design, start with the SVG or PNG files, which are easy to insert into websites or documents. More experienced users might prefer the AI or EPS files for advanced editing in vector design software. Either way, the template gives you the tools to create professional-quality visuals without starting from scratch.
Final Thoughts
The Environmental Damage Vector Infographic is more than just a design tool—it’s a way to make complex issues accessible. Whether you're an educator, creator, business owner, or advocate, this template helps you communicate more effectively and engage your audience in meaningful ways.
By combining data with visual storytelling, you can turn numbers into narratives and facts into action. And in a world where environmental awareness is more important than ever, having the right tools to share that message can make all the difference.